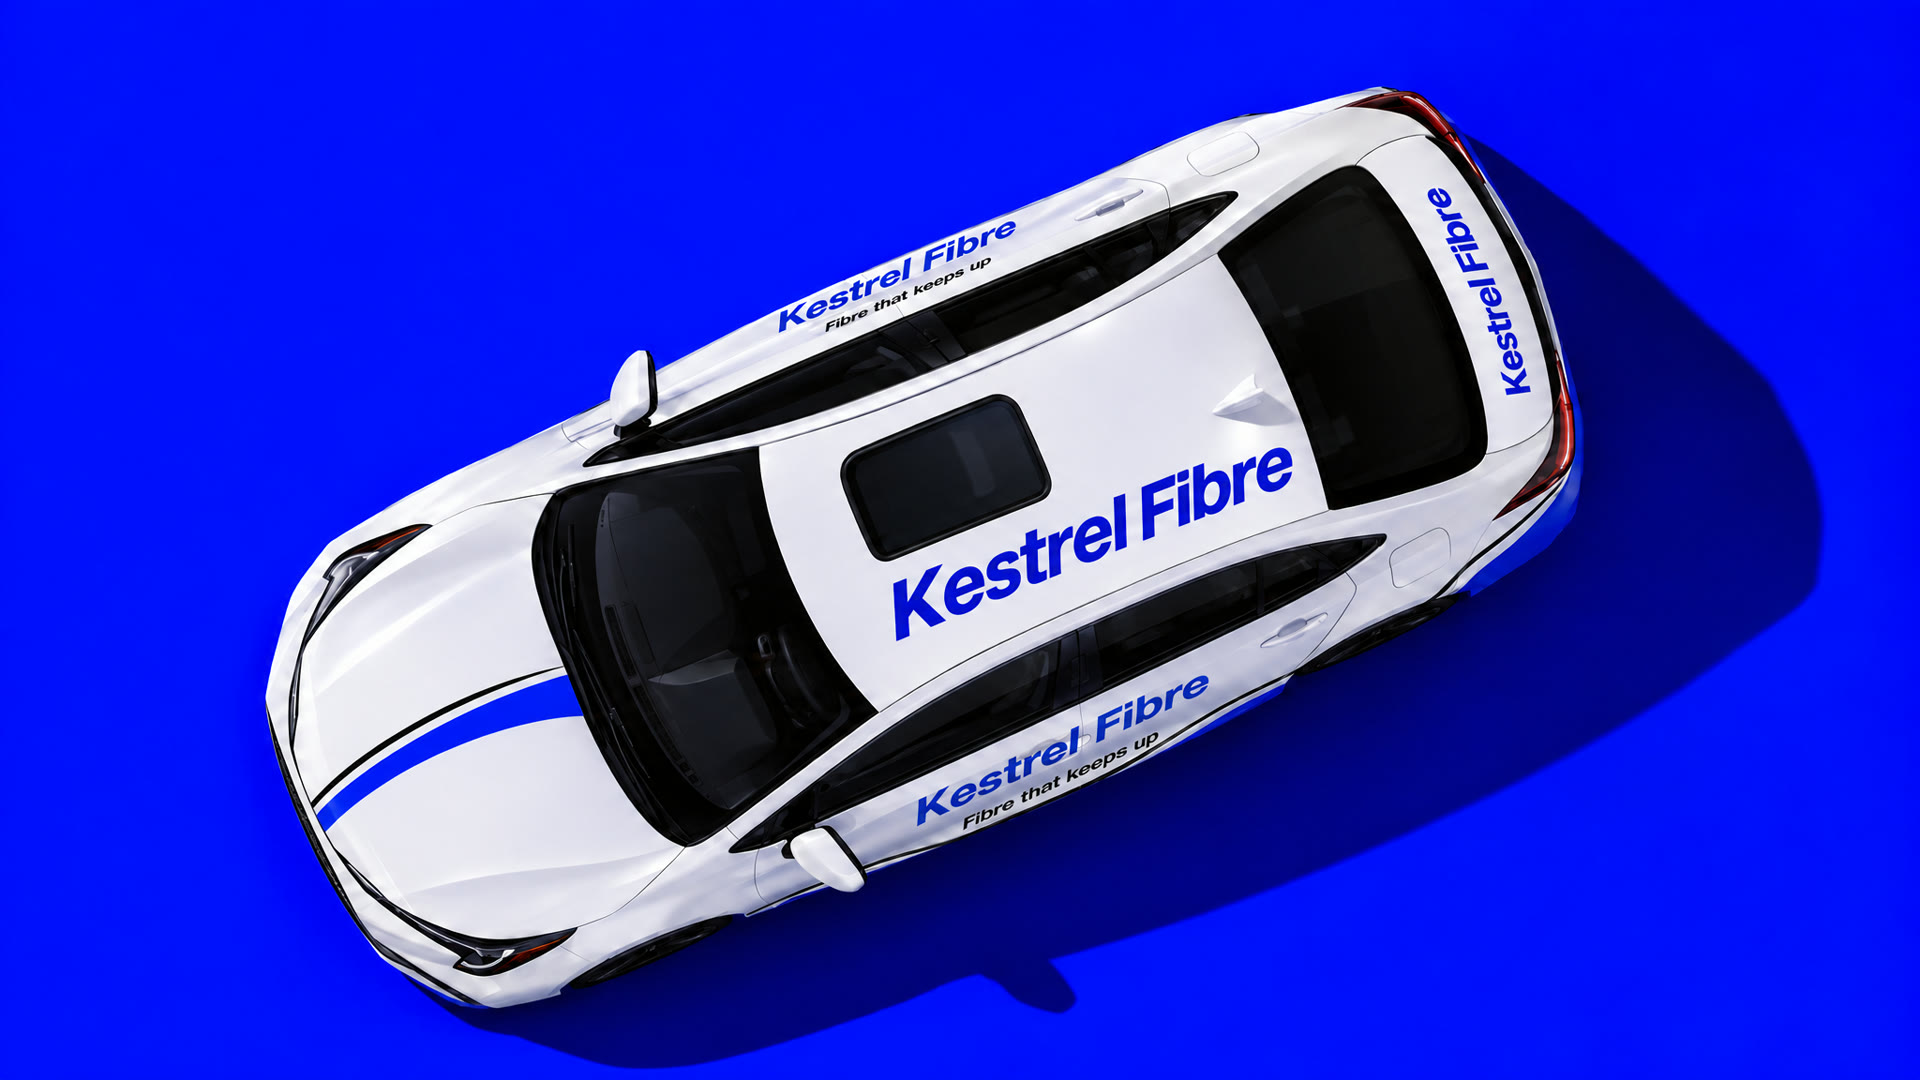
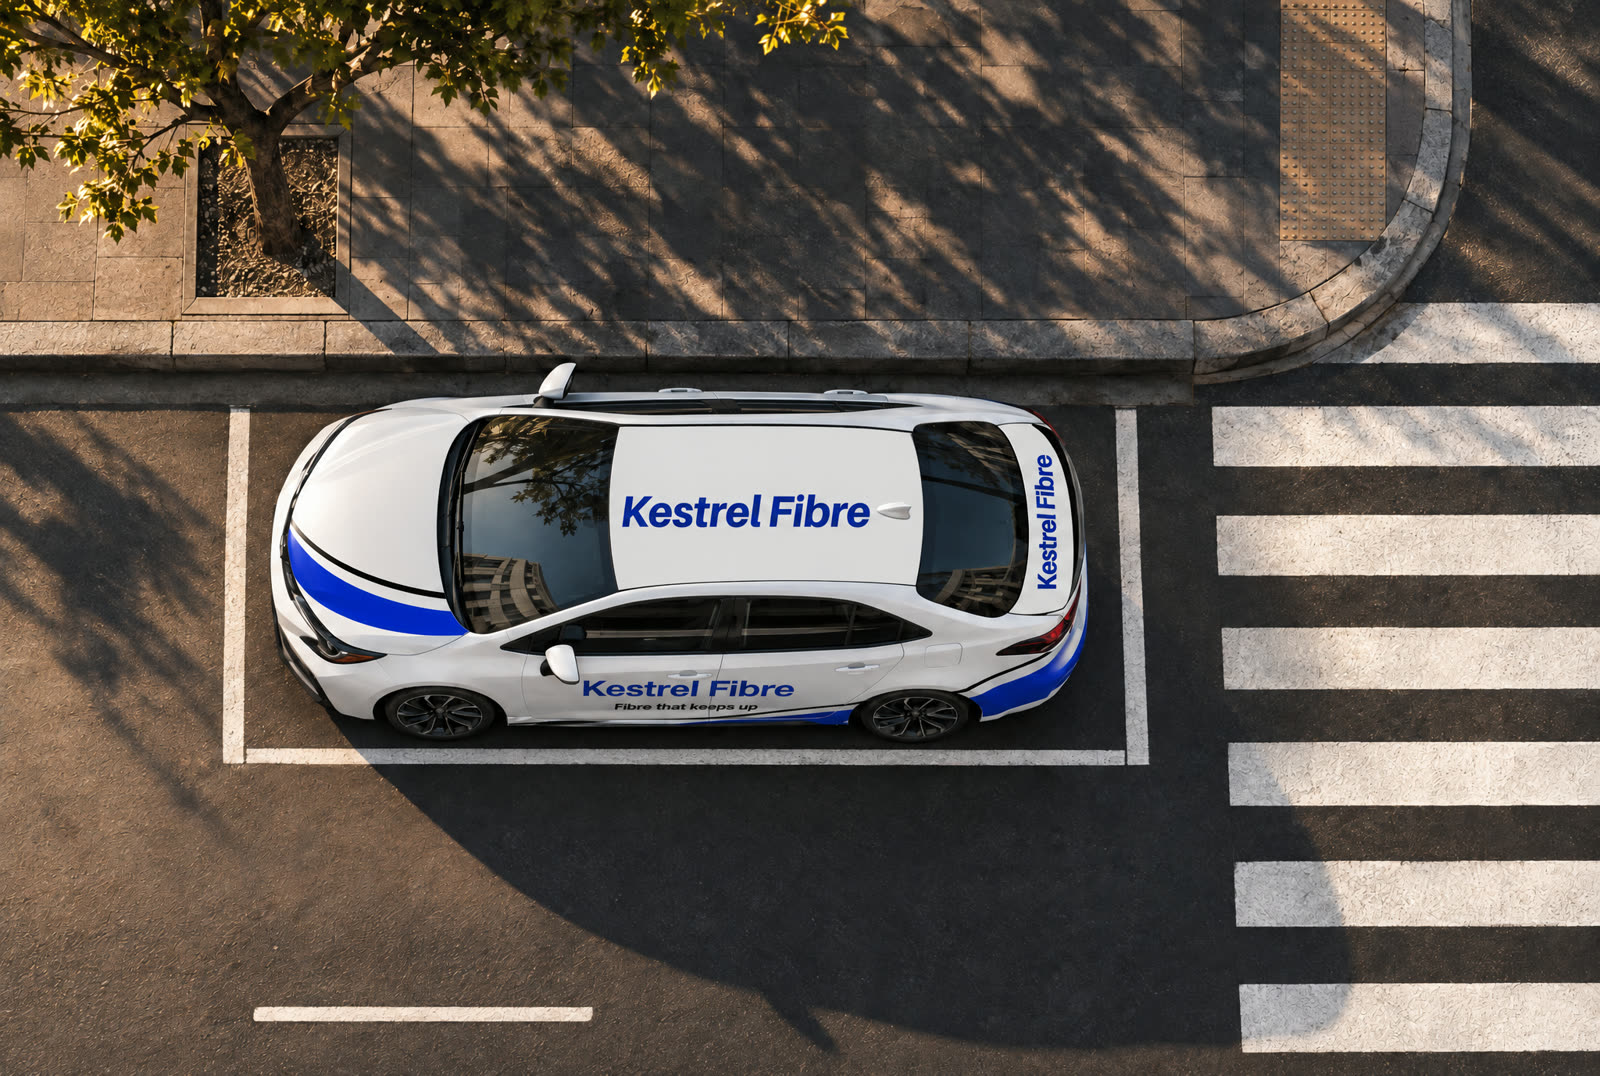
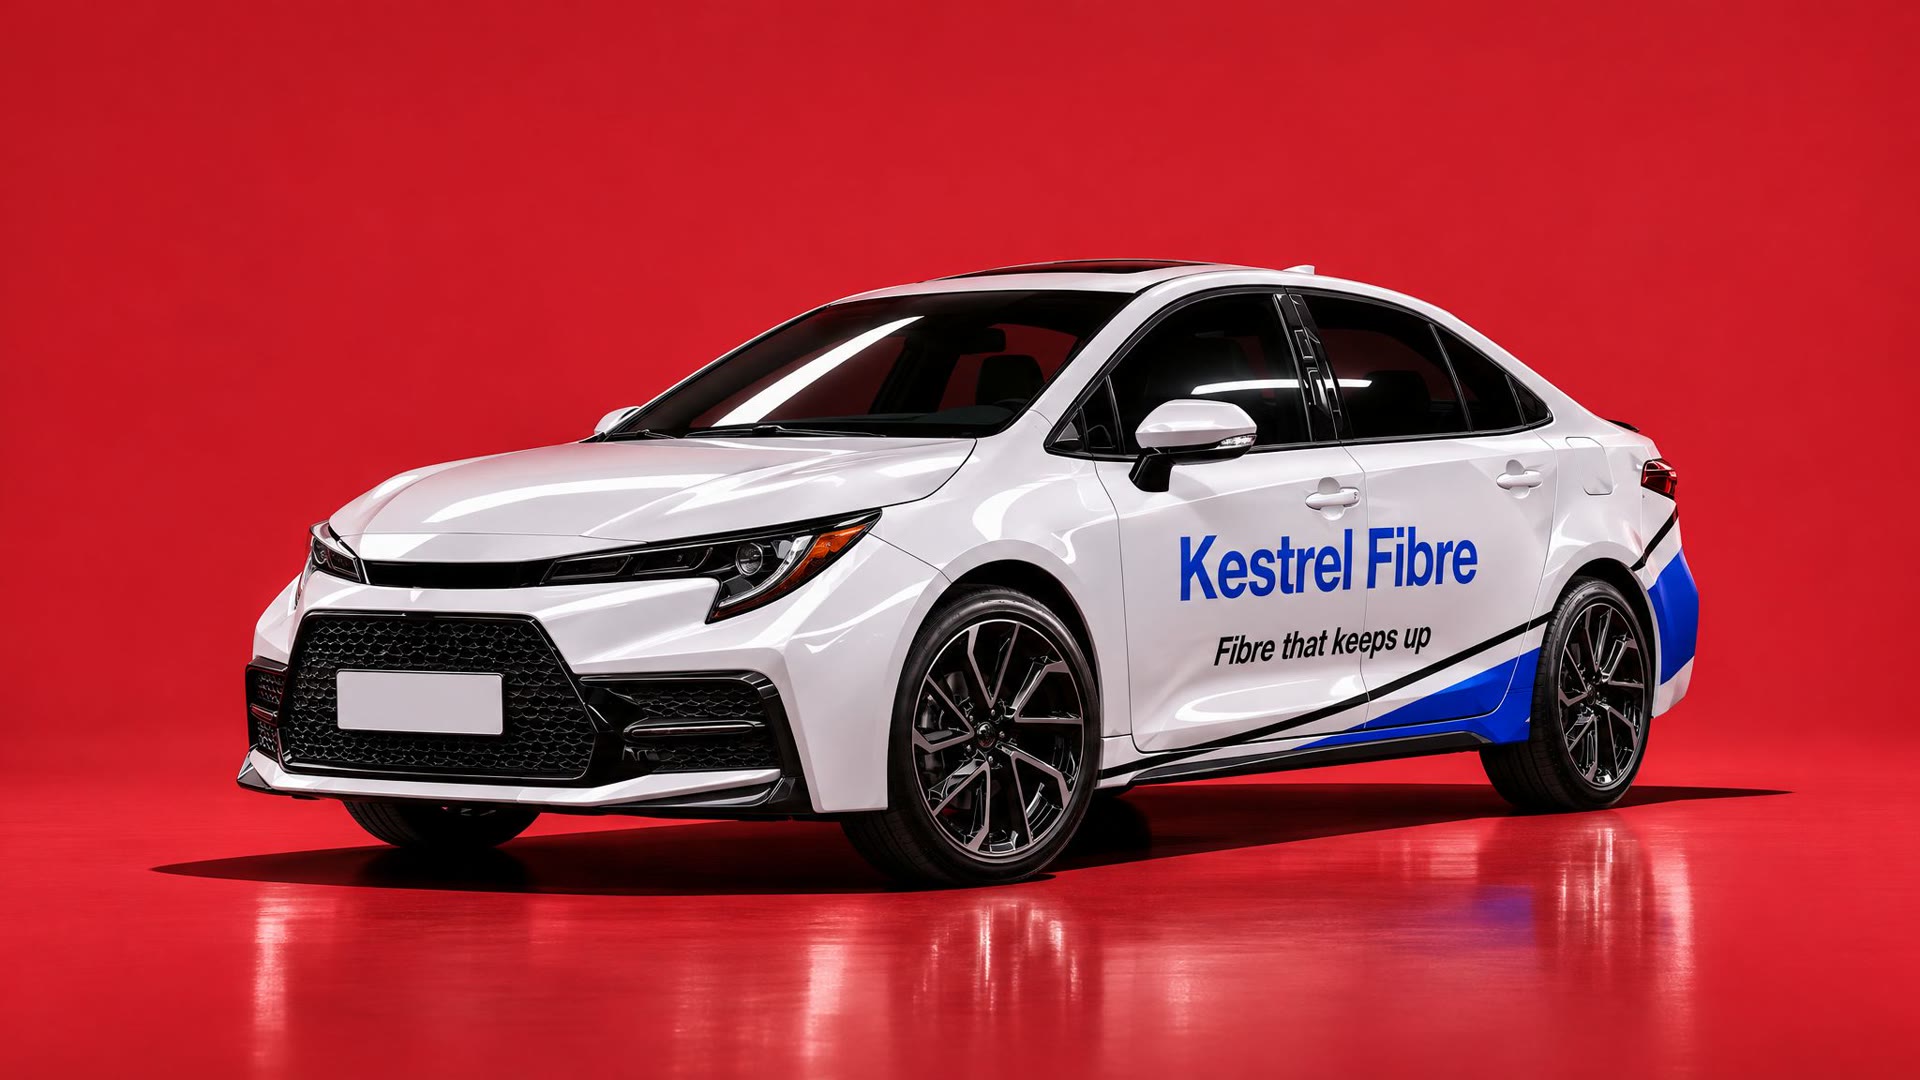
Your brand on the cars a city already watches.
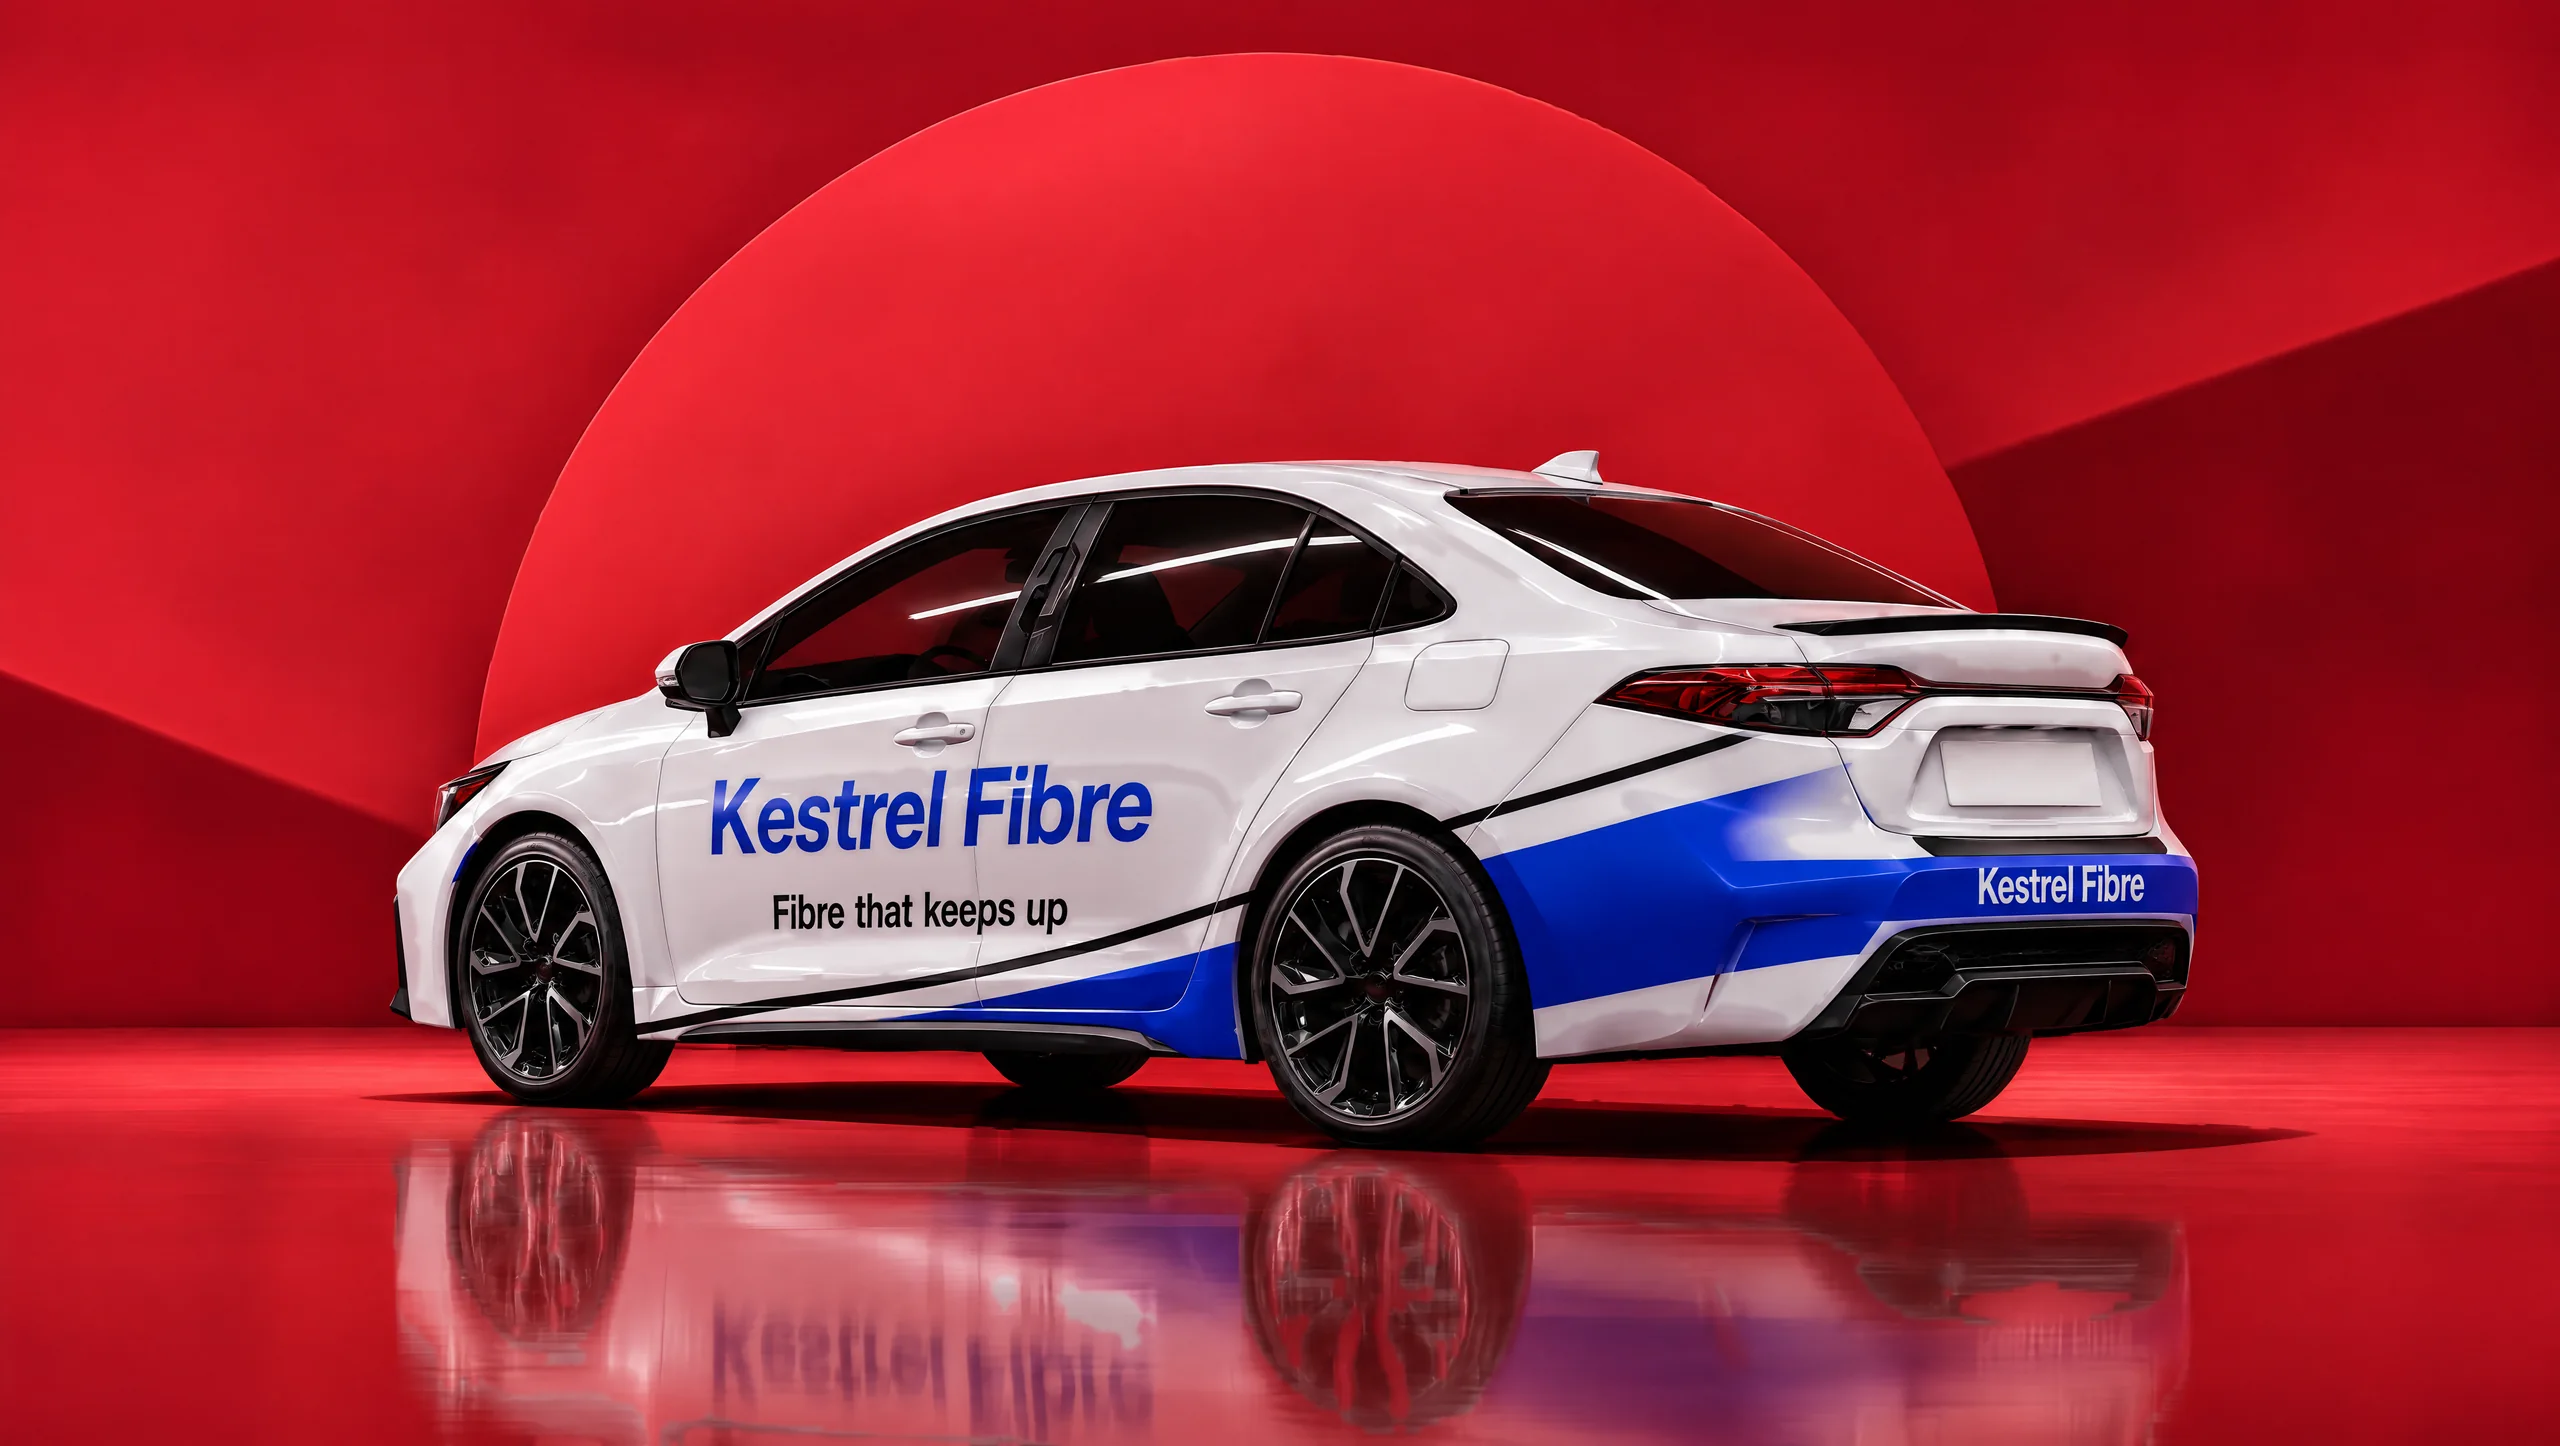
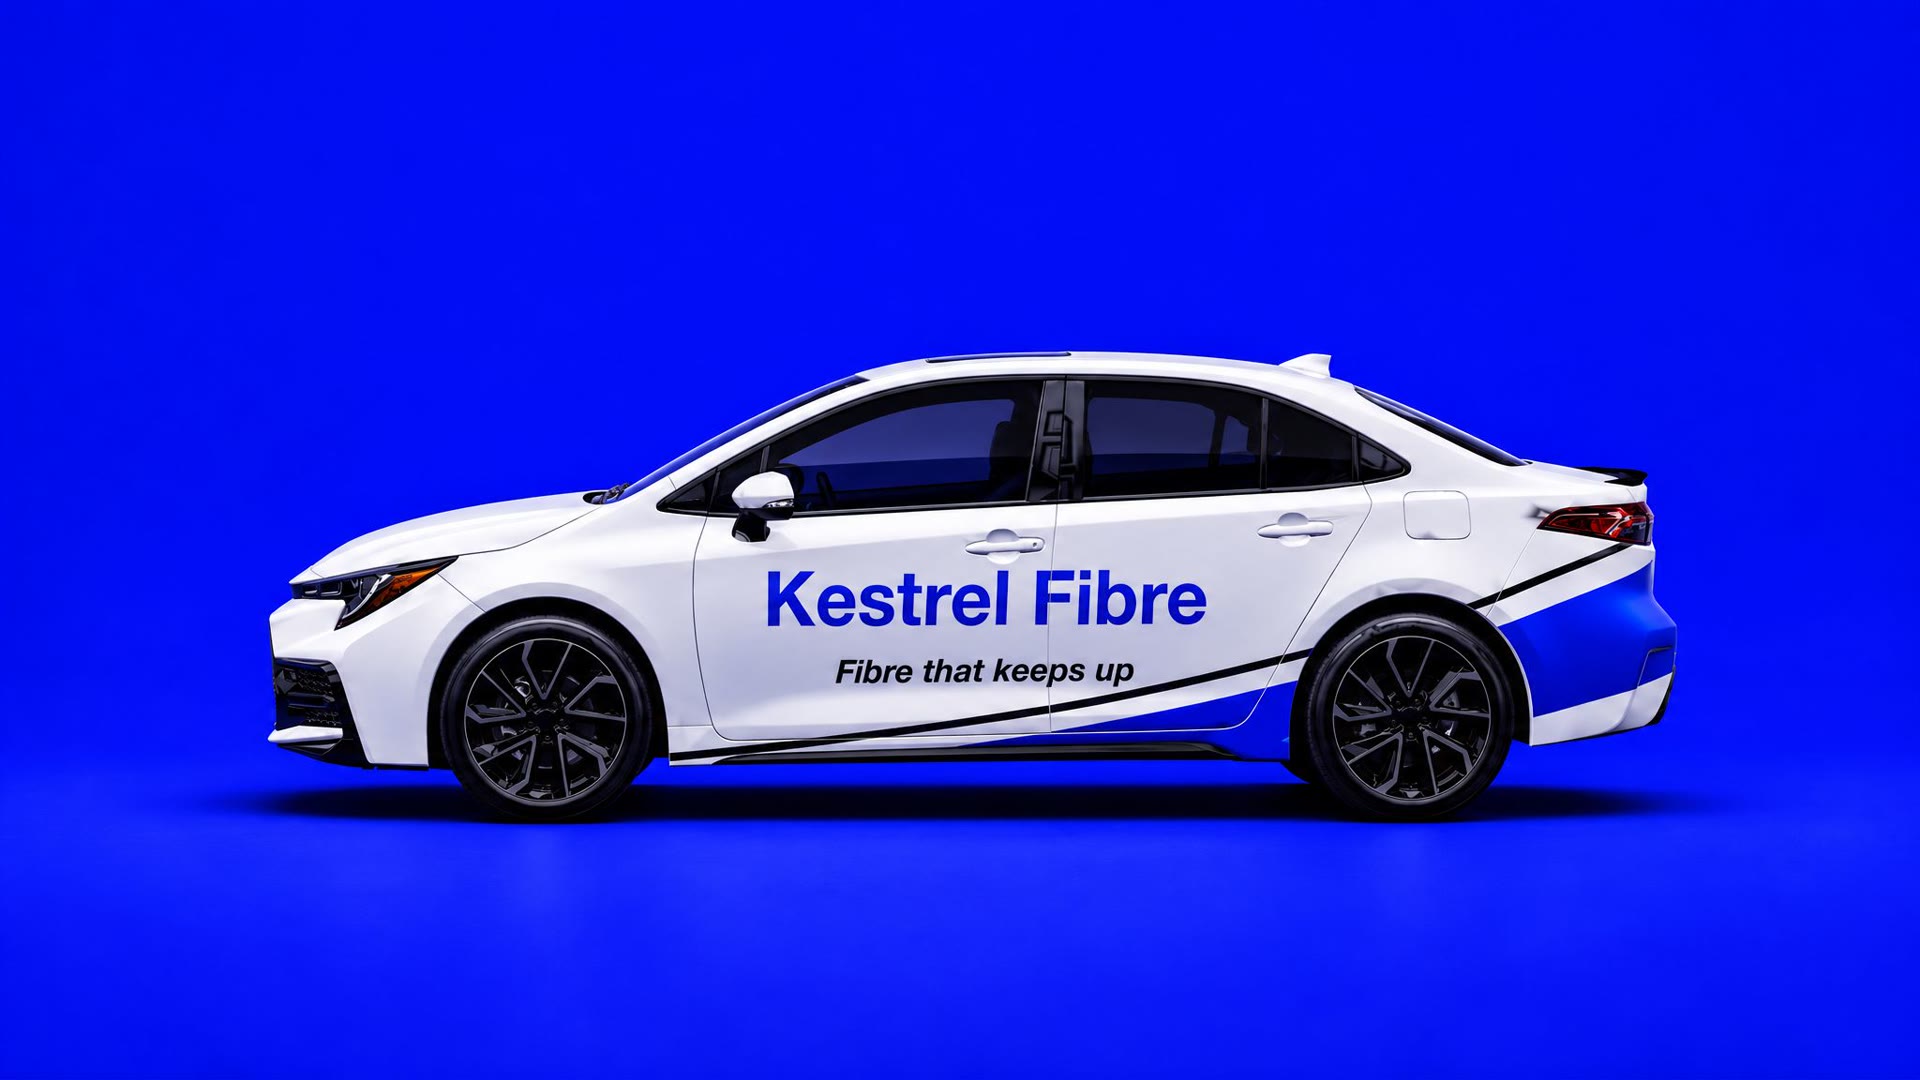
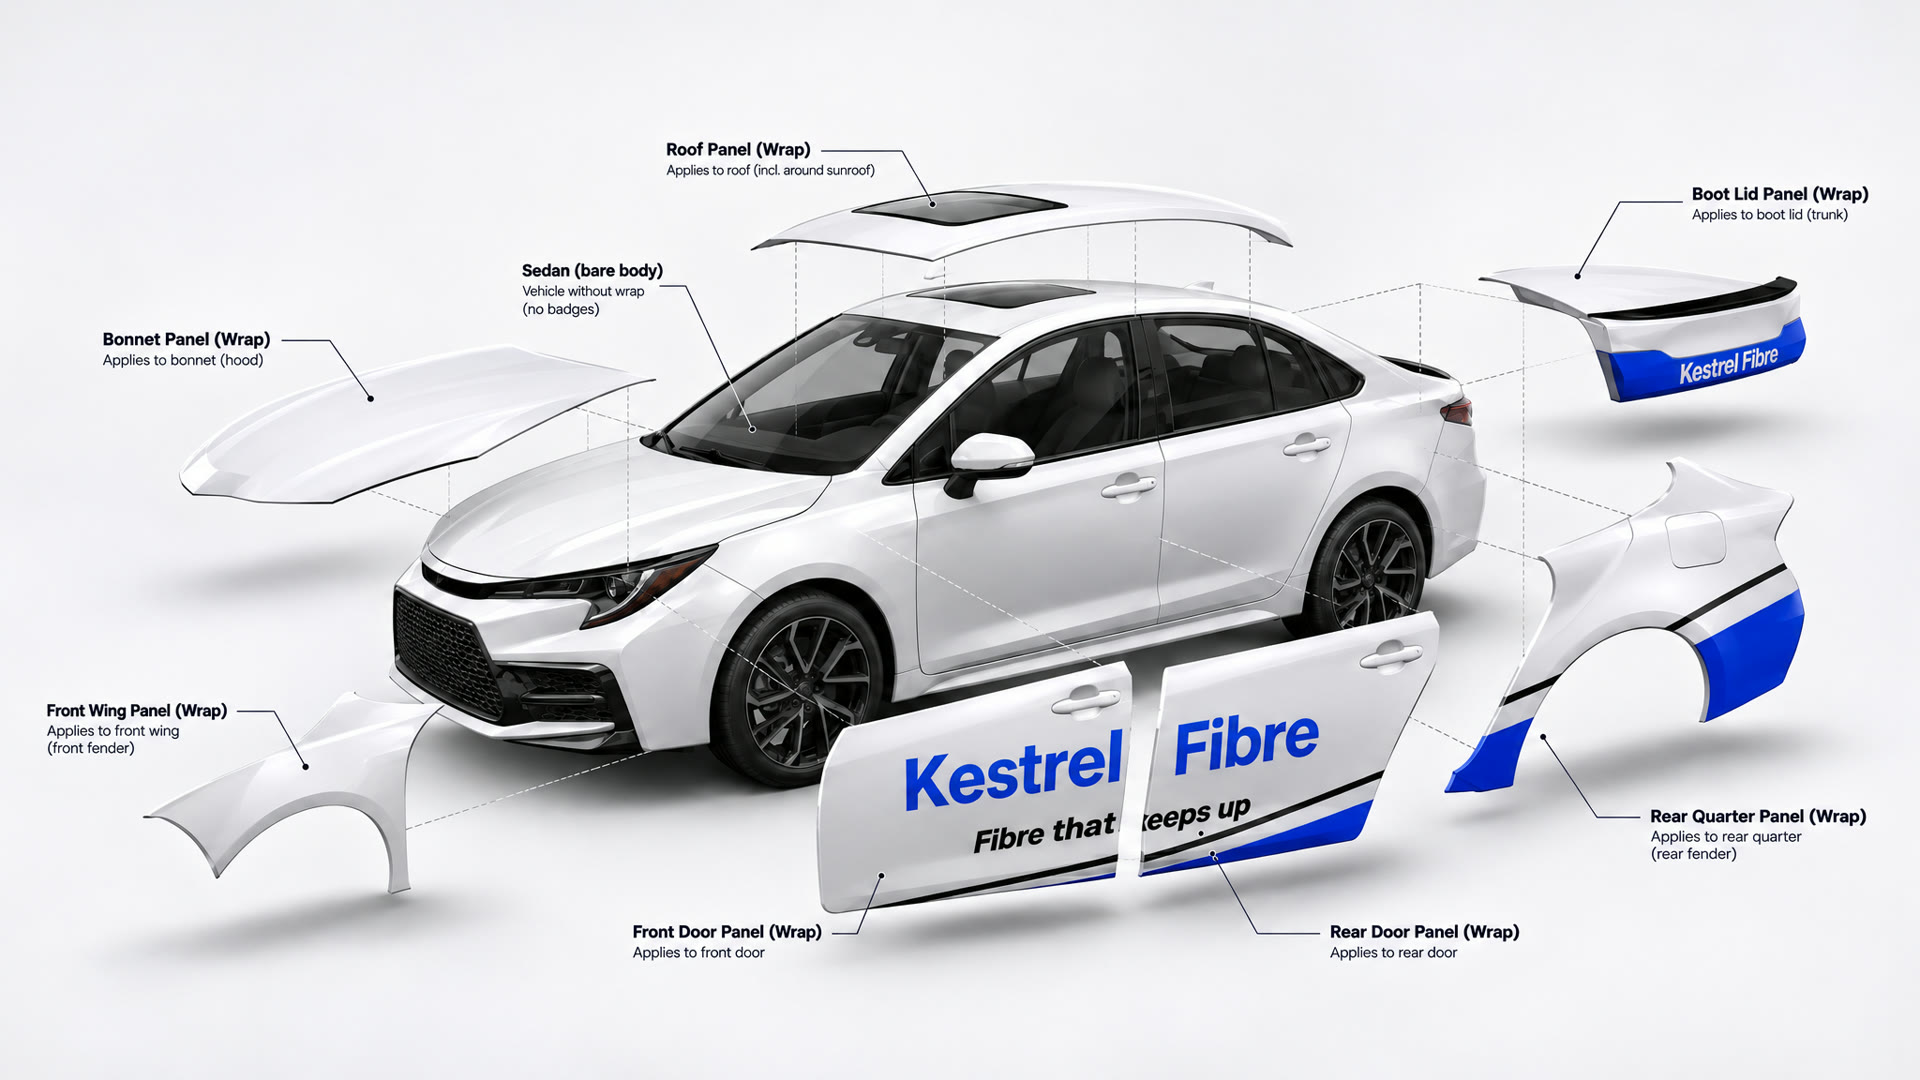
A plain white car.
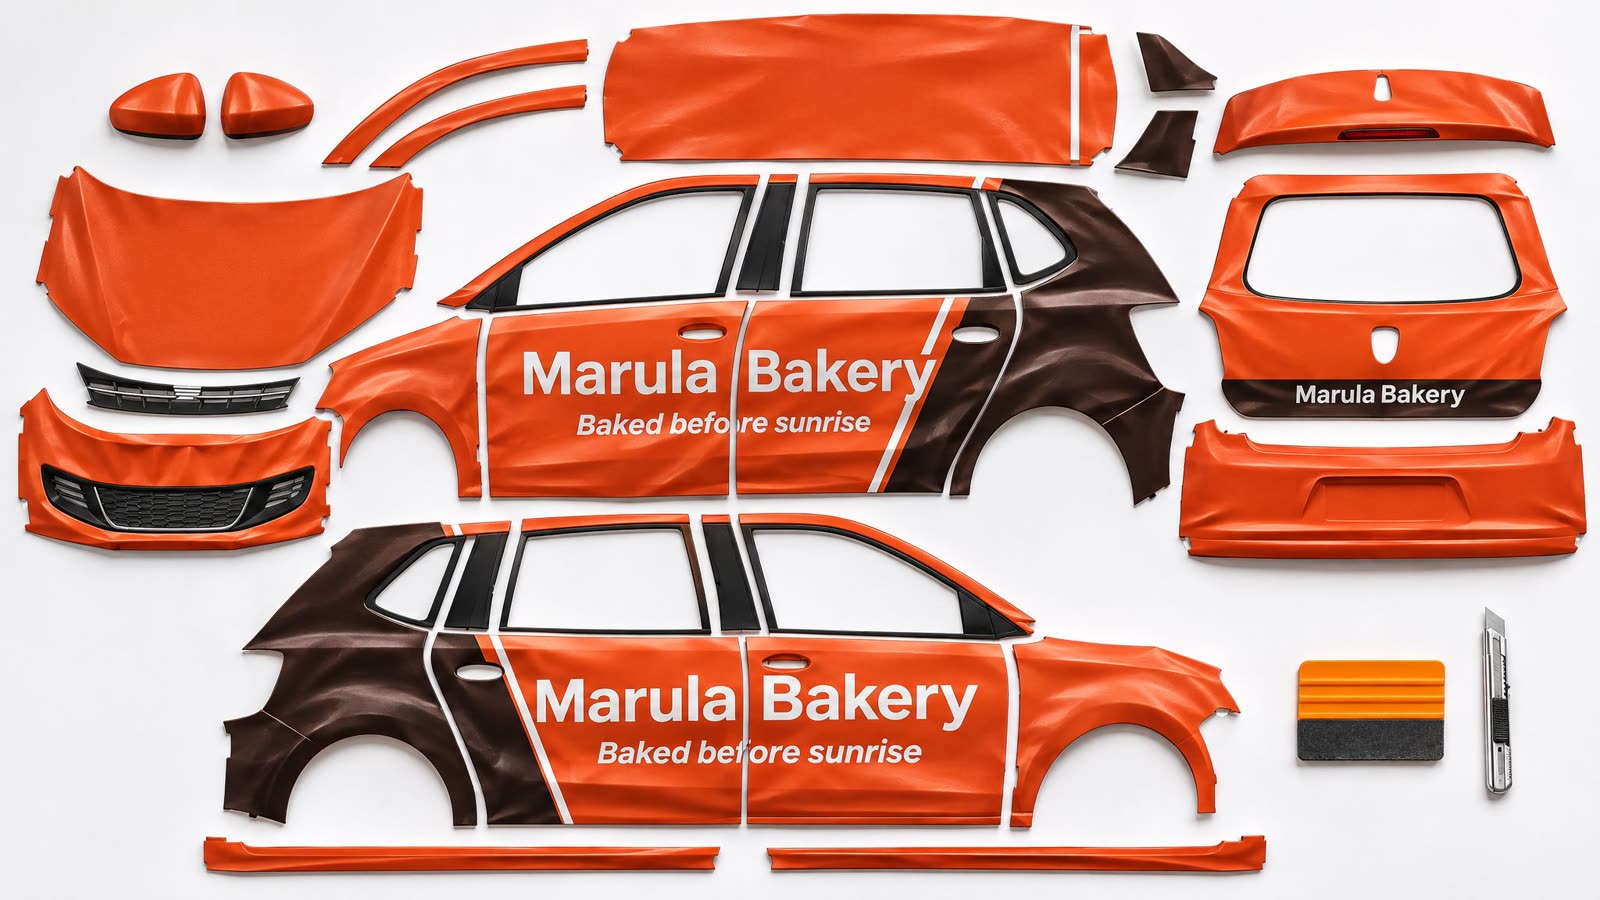
Your artwork goes on, panel by panel.
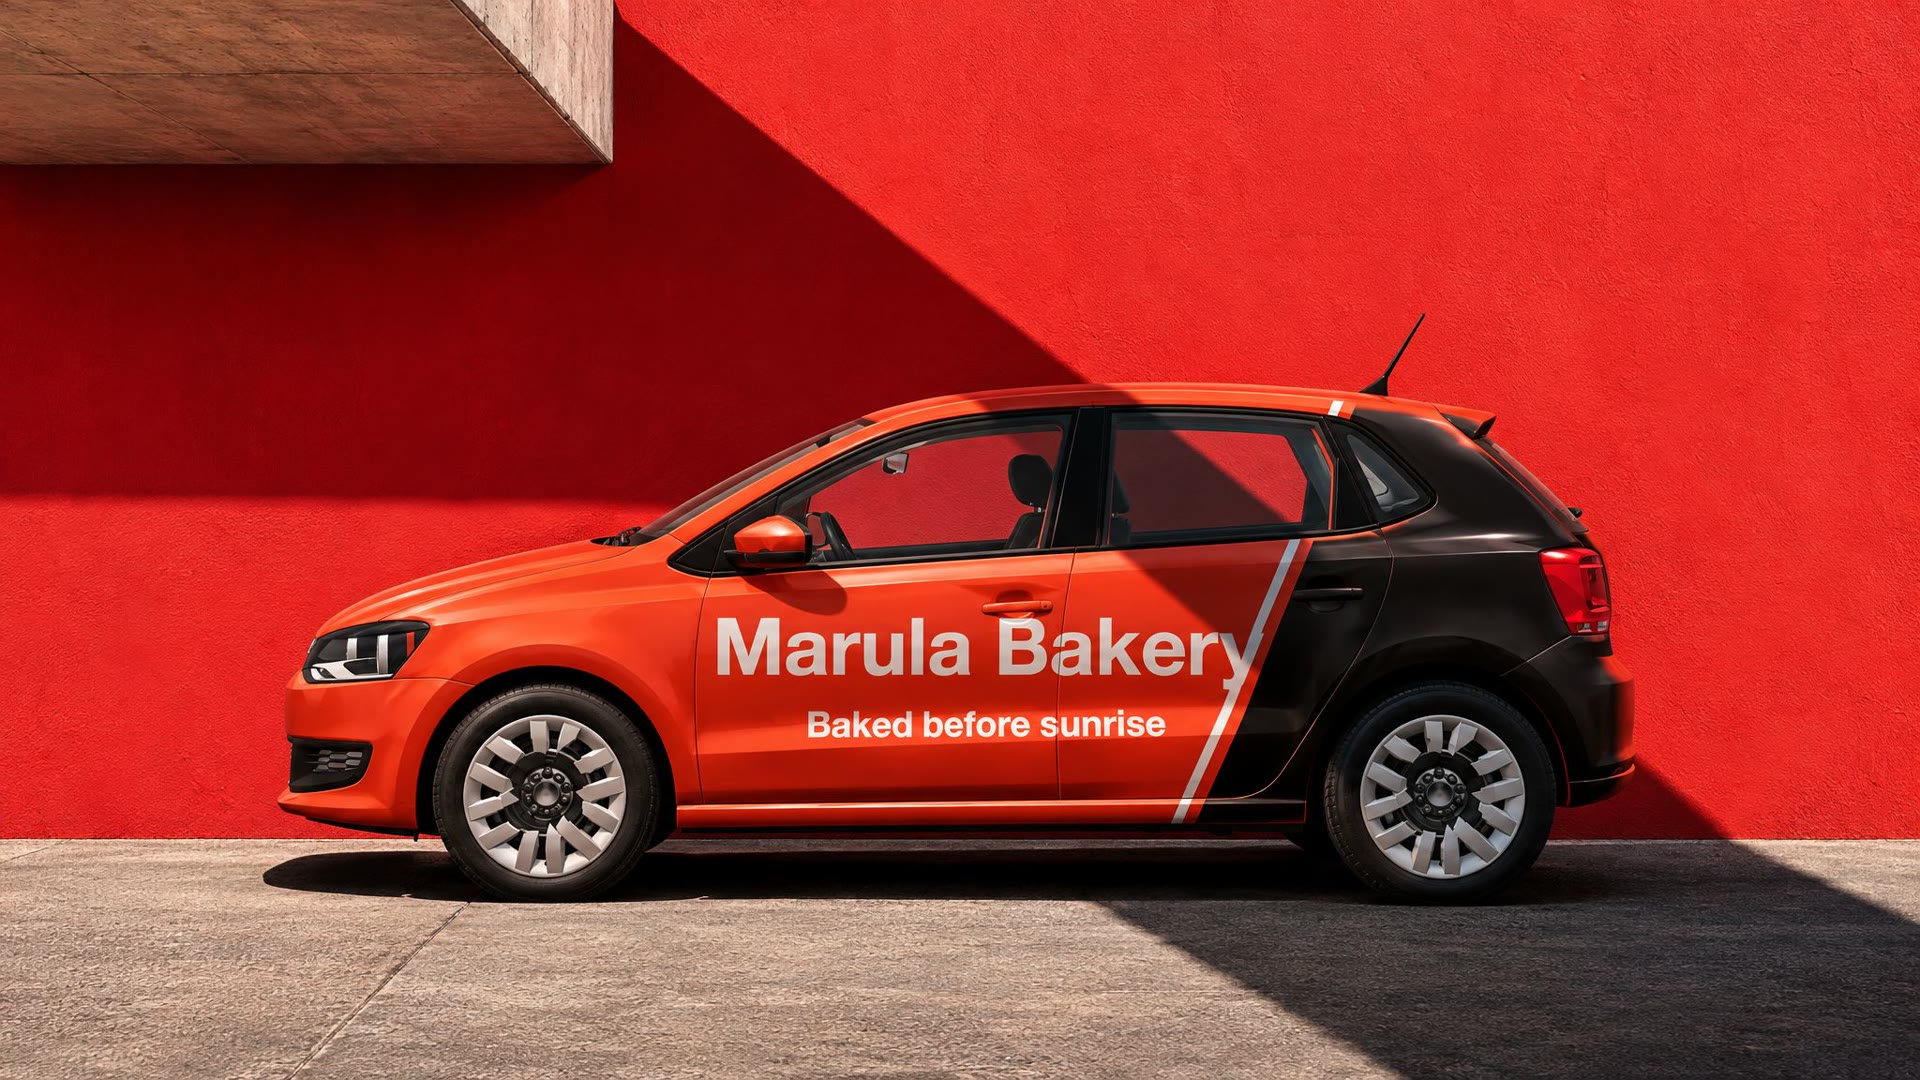
Then it drives where people are.
We count the people around it, hour by hour.
0estimated views in a month, one car
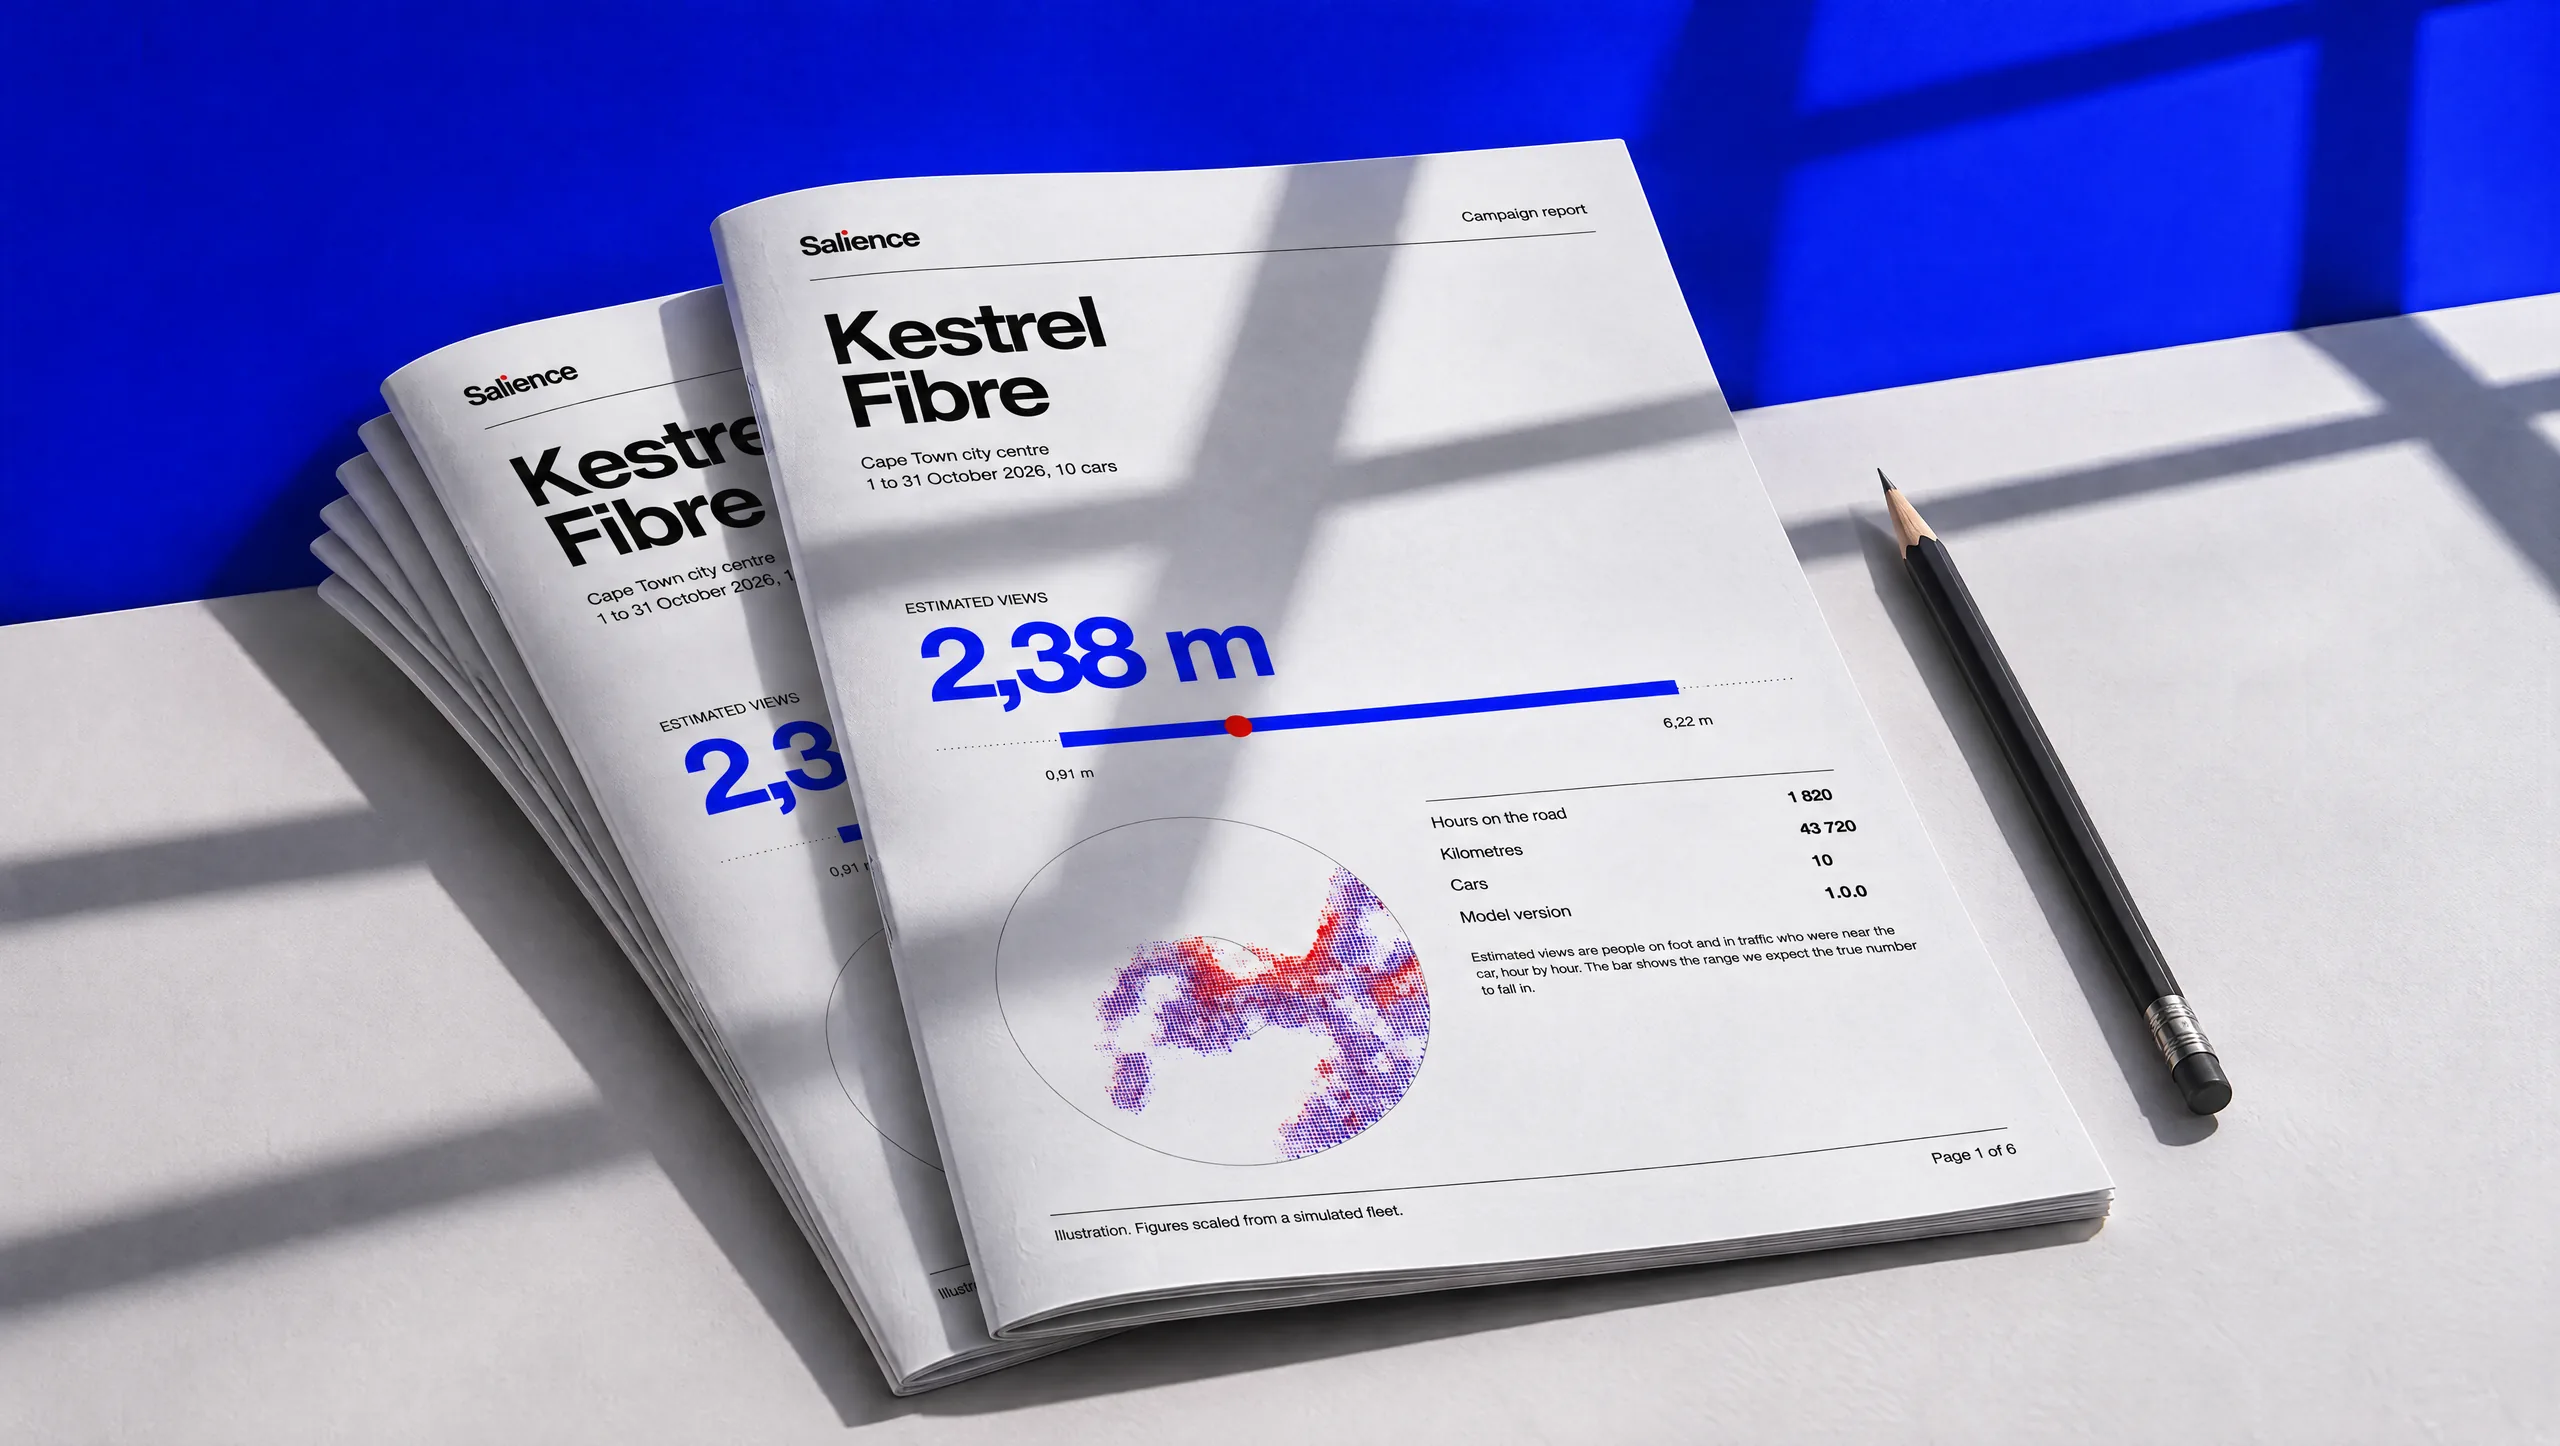
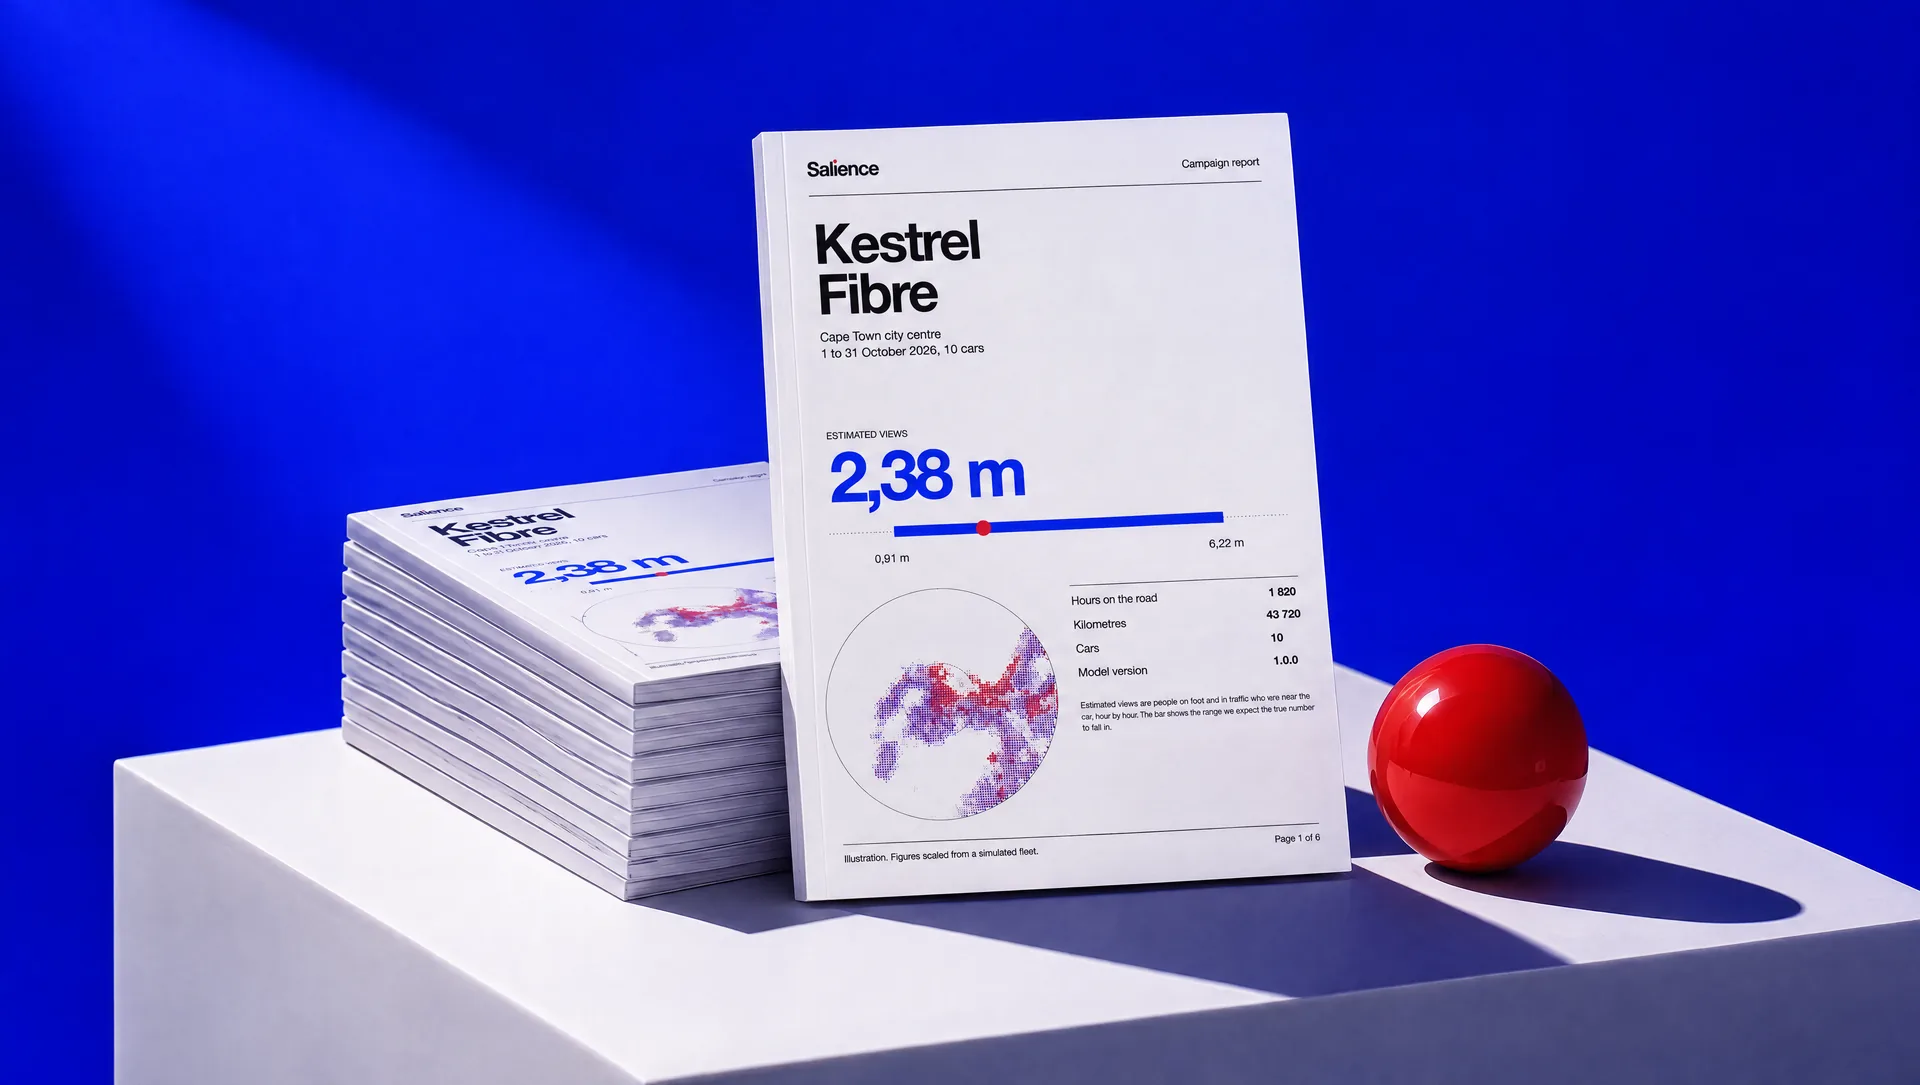
One car, one month in Cape Town city centre: about 238 000 estimated views.
A range you can check, not one flat number. Plan your campaign →
Illustrative route over real daytime population data (WorldPop, GHSL). Estimates are scaled from a simulated fleet until our first cars run.
Most wrap campaigns report where the car went. We estimate who was there to see it.
How it works
Design it. We drive it. You see who saw it.
- 01
Design
Put your logo or artwork on the cars rideshare drivers already use, and turn it in 3D. Wrap both sides, add the rear, or cover the whole car.
- 02
Drive
We match drivers whose usual routes keep them in your area, wrap their cars and pay them monthly to keep driving as they do.
- 03
Measure
Every trip is scored against who was around, hour by hour: people on the pavement and in the traffic beside the car. You get ranges you can check, not one flat number per car.
Compare
Same budget.
Different proof.
Where
Busier areas put a car in front of more people. The price follows the people.
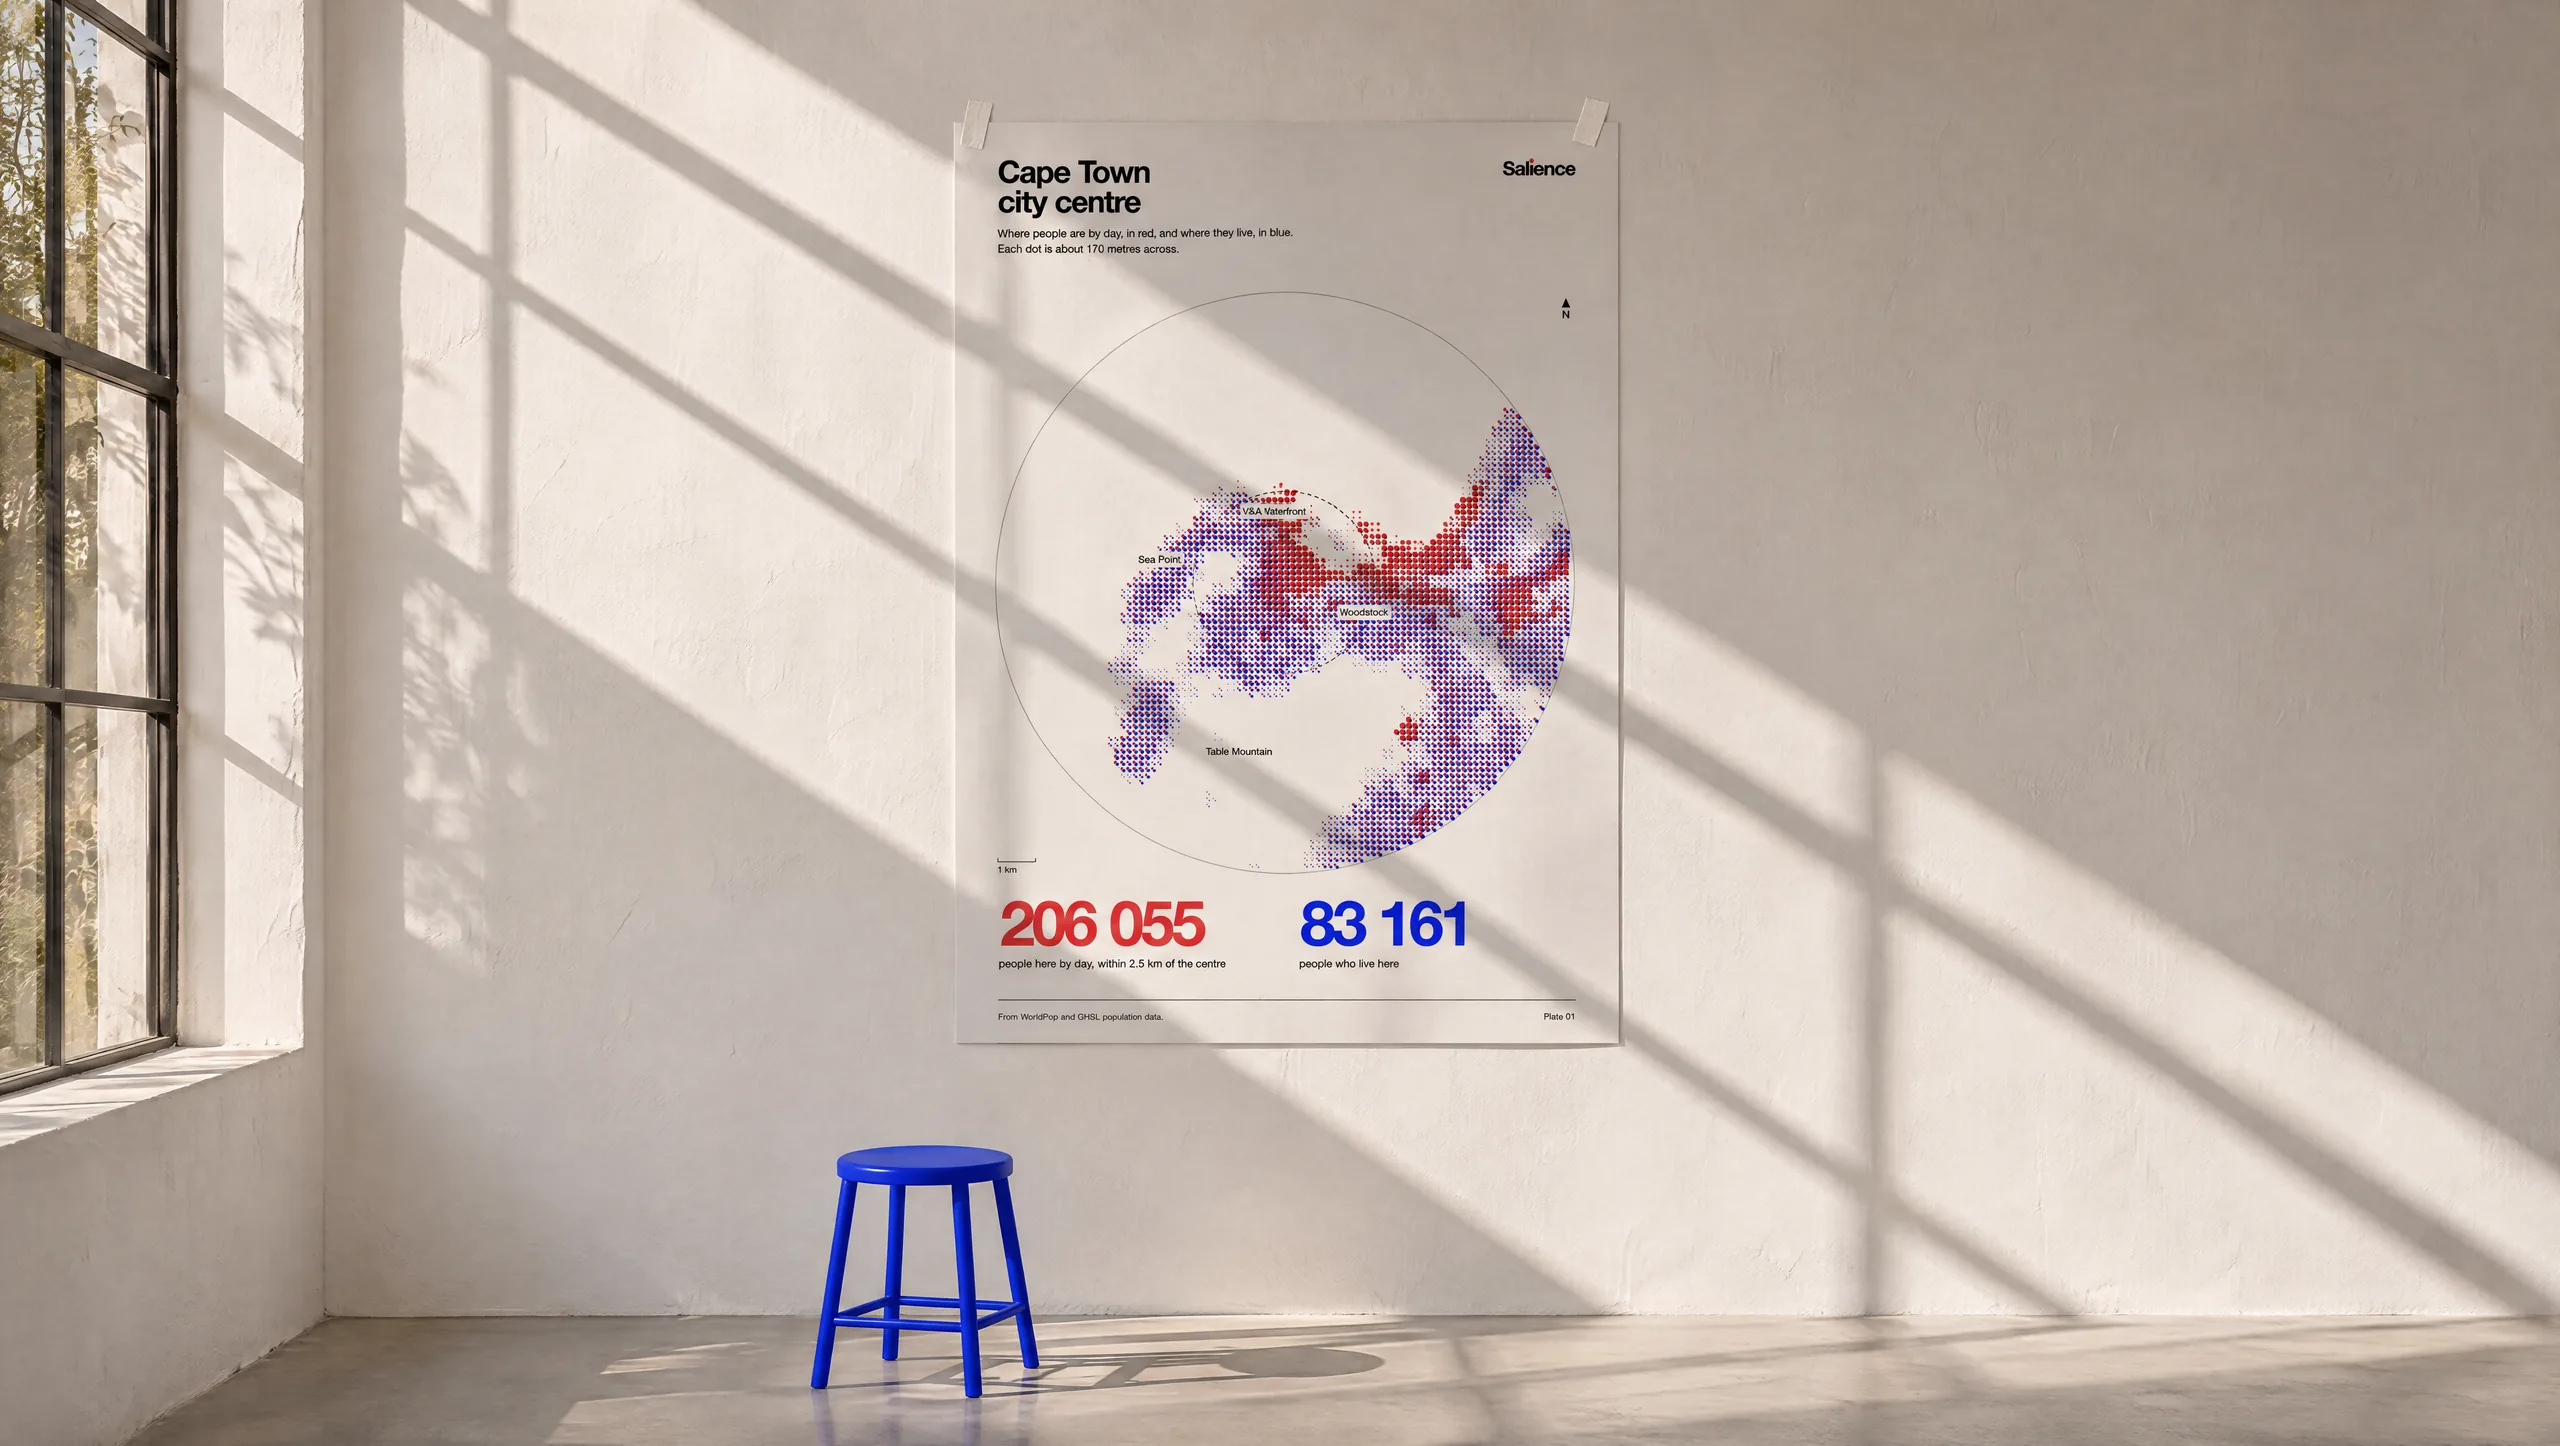
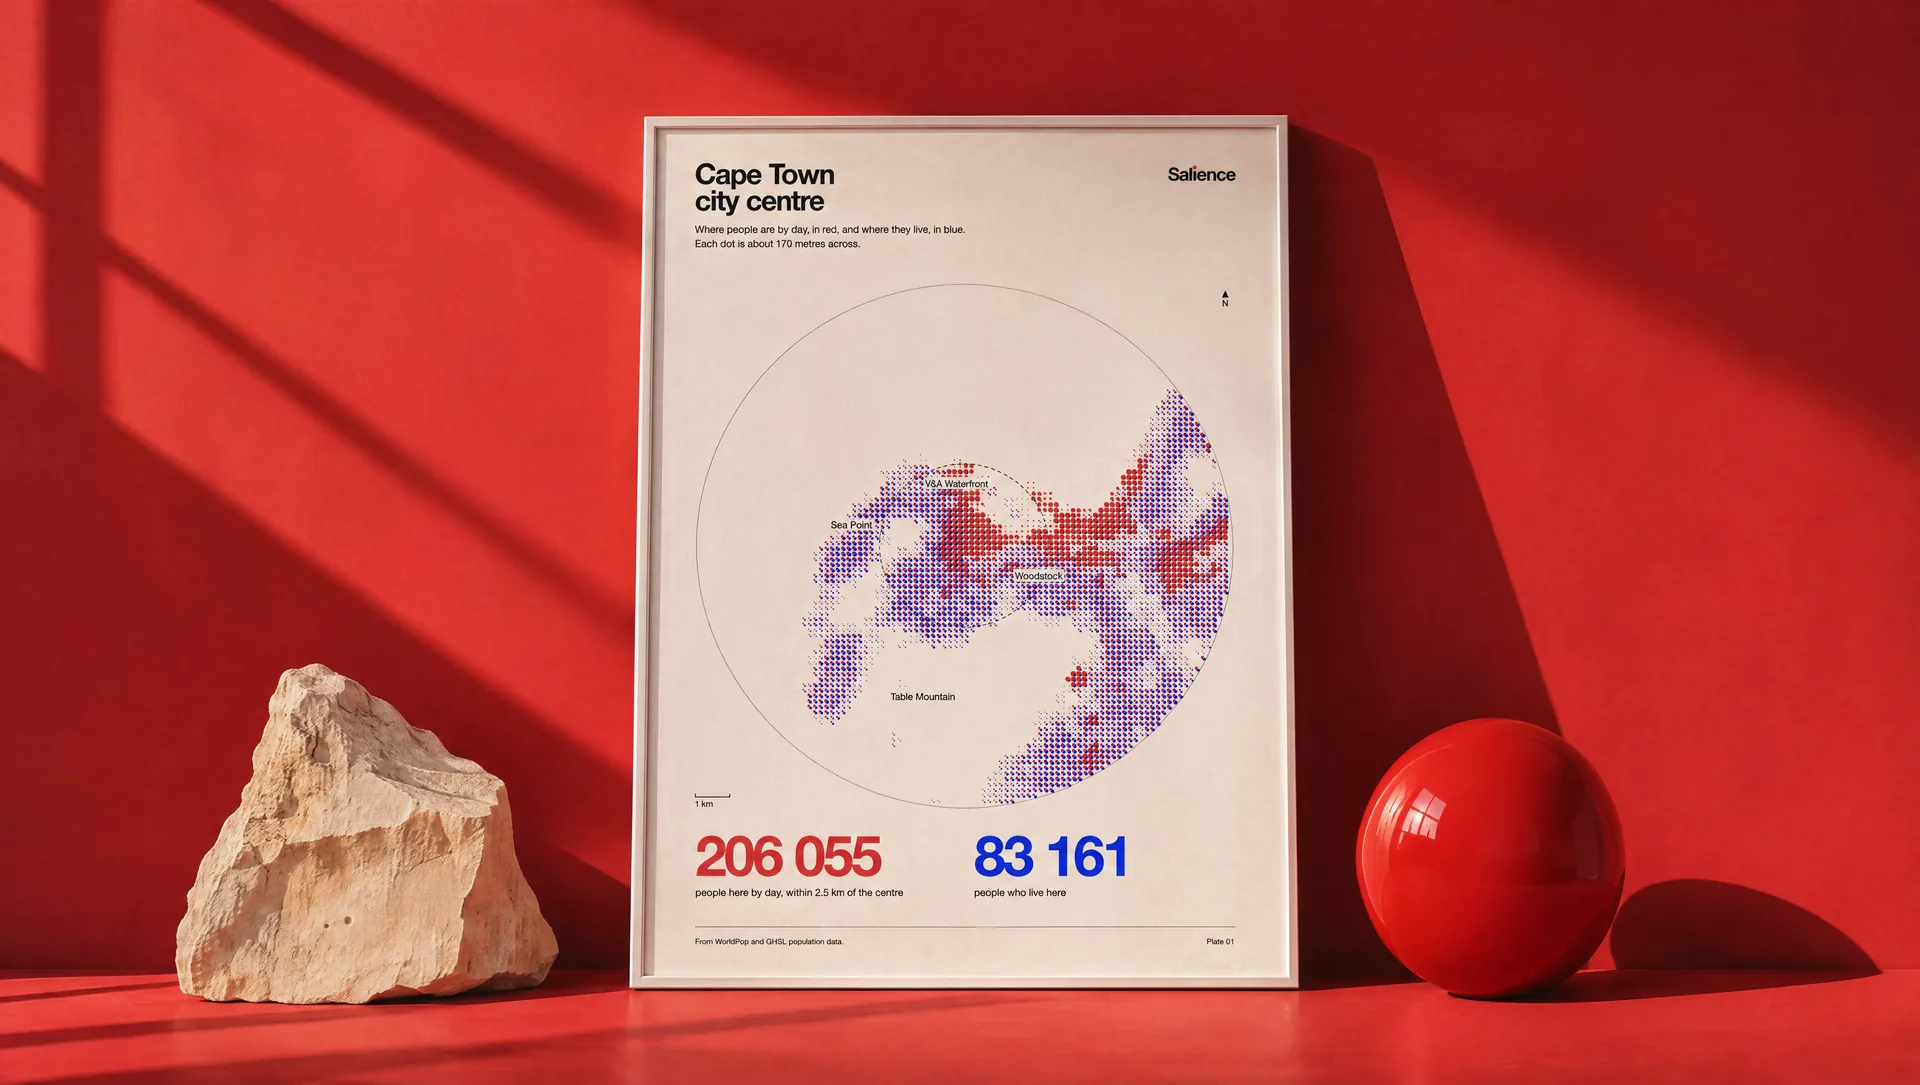
From WorldPop and GHSL population data, the layers our measurement uses. Each map is 24 km across. Estimates are scaled from a simulated fleet until our first cars run.
The report
See what a campaign report looks like.
Estimated views with their ranges, kilometres and hours, and a map of where the wrap was seen, without exposing any driver's movements.
Open a sample report